- Sample:
- 013a92ea6df2995a8cdef11527dc4bda0b4a2e8dc642f7461c1cedb42297cadb (Bazaar)
- Tools used:
- Malcat
- Difficulty:
- Intermediate

While many of you use Malcat for its main purpose, that is malware analysis, Malcat's scripting capabilities are often overlooked. And that's too bad, because Malcat features a powerful yet simple API which is rather easy to learn. Now, why would you want to learn Malcat's API when there are more wide-spread alternatives around, lika IDA/ghidra/binja scripts? For a couple of reasons:
- In python we trust. Although Malcat's analysis core is coded in C++, a lot of python is used internally (parsers, anomalies, etc.). We have thus put a lot of effort into the python API, it's not something that was just put on top.
- It is available to free users. If you write useful scripts, your code can be used by everyone. Regarding scripting, the only benefit of paid users is being able to run scripts from the command line, while free users have to run them through Malcat's script editor.
- You can extend Malcat. Several parts of Malcat are written in python and use the API. You can for instance program a new parser, write your own transforms or improve the anomaly scanner.
And if you're not yet convinced, let us discover the API through a small use case: writing a Latrodectus desobfucator.
Key concepts
Before diving into Latrodectus, let us cover a couple of core concepts that we will need later. First and foremost, in Malcat scripts everything starts with the analysis object. This object can have two origins:
- If you run your script through Malcat's script editor, you can access directly a globally defined
analysisvariable that contains the analysis result of the file currently open in the UI. - Scripts using Malcat's headless library need to call the malcat.analyse() function, which will also return a malcat.Analysis instance:
analysis = malcat.analyse("/samples/latrodectus")
print(analysis.architecture)
>>> Architecture.X64
Every bit of information that you can see in Malcat's UI stems from this malcat.Analysis instance: you can read/edit raw bytes, query high-level analysis, disassemble, decompile, etc. No 100s of global functions, just a simple, well-documented python object. Now let us see what kind of information you have access to.
Raw file access
The lowest-level access that the analysis object provides is access to the raw file through the analysis.file object. This object simply represents the file as stored on-disk. Using this object you can access individual bytes:
print(analysis.file[0x40]) # read byte at offset #40
but also read a bytes range:
print(analysis.file[0x40:0x60]) # read bytes [#40-#60[
or read ascii, utf-8 or utf-16 strings. You can even search things using PCRE2 regular expressions:
match_off, match_len = analysis.file.search(r"PE\x00\x00", start=0, size=len(analysis.file))
if match_len:
    print(f"Pattern found! {match_len} bytes at #{match_off:x}")
And since Malcat's API tries to be pythonic, editing the file is also rather simple:
analysis.file[2] = 56
analysis.file[2:4] = b"ab"
NB: if you run your script in Malcat's script editor, all edit operations are automatically registered to the UI's undo/redo list. If you don't want this, you can always configure the undo/redo behavior via the analysis.history object. You can also group multiple edit operations together.
Addressing
Now before going further, a quick note regarding Malcat's addressing space. When you consider a runnable PE, ELF or Mach-O program and you talk about the address of a program data, it can be usually expressed as either:
- a physical address, i.e. an offset into the program as stored on disk
- a virtual address, i.e. a memory pointer, once the program is loaded into memory by the O.S
- a relative virtual address, a virtual address relative from the program imagebase
To make things worse, some program bytes can exist only in the physical space (e.g. a PE certificate), only in the virtual space (e.g. the .bss section) or in both spaces (e.g. the .text section). This can be confusing. Adds to this the possibility for the virtual space to have gaps, and it starts to be really hard.
In order to simplify addressing, Malcat works in a single, contiguous address space named the effective address space which contains both physical and virtual address spaces and get rid of any gap. This makes things a lot easier.
The only exception is the object seen previously: analysis.file. This object only manipulates physical addresses / file offsets for obvious reasons.
You get of course functions to handle different types of addresses:
- analysis.ppa(ea) to pretty-print an effective address
- analysis.a2p(ea) to convert an effective address into a physical one / file offset
- analysis.p2a(offset) to convert a physical address / file offset into an effective address
- analysis.a2v(ea) to convert an effective address into a virtual address
- analysis.v2a(va) to convert a virtual address into an effective address
- analysis.a2r(ea) to convert an effective address into an RVA
- analysis.r2a(rva) to convert a RVA into an effective address
From now on, every time that we will manipulate addresses, these will be addresses in the effective address space.
Accessing annotations
Now that addressing has been covered, let us dive into the core of Malcat's API: the annotations. Malcat has performed several kinds of analysis for you, which can be accessed using different member variables of the analysis object (see the whole list here). These analyses are called annotations, since all they do is attach python objects to the effective address space of the analysed file. Annotations are accessed also in a pythonic way, with a dictionary-like syntax and iterators.
Let's take an example: the function analysis, accessed through the analysis.fns object. It annotates the whole effective address space with malcat.Function objects. Say you want to access a function defined at the virtual address 0x401000, you would write:
fn = analysis.fns[analysis.v2a(0x401000)]
print(fn.name)
>>> sub_401000
Now say you want to iterate through all functions defined in an interval:
start = analysis.v2a(0x401000)
end = analysis.v2a(0x402000)
for fn in analysis.fns[start:end]:  # to go through all functions -> for fn in analysis.fns:
    print(f"{fn.name} found at {analysis.ppa(fn.address)}")
>>> sub_401000 found at 0x00401000 (sub_401000)
    sub_401010 found at 0x00401010 (sub_401010)
    sub_401130 found at 0x00401130 (sub_401130)
    ...
Now say you don't know whether a function is defined at a given address or not. You can check it using the following syntax:
address = analysis.v2a(0x401000)
is_function_present = address in analysis.fns
# equivalent
fn = analysis.fns.find(address)
is_function_present = fn is not None
You can also query the next/previously defined function:
address = analysis.v2a(0x401000)
fn = analysis.fns.find_forward(address) # returns the function defined over VA 0x401000 or the next function starting after 0x401000
if fn is None:
    fn = analysis.fns.find_backward(address) # is there a function defined before 0x401000?
    if fn is None:
        raise ValueError("no function defined")
And ... that's mostly it! Of course more method are available, but using this simple paradigm you can access most of Malcat's annotations. Say you want to list all strings found in the .data section? Use the strings annotation:
data_section = analysis.map[".data"]
for s in analysis.strings[data_section.start:data_section.end]:
    print(f"* string {repr(s.text)} found at offset #{analysis.a2p(s.address):x}: encoding={s.encoding} score={s.score}")
Straightforward, right? Now you want to look for embedded files? Again, same syntax, but use the annotation named carved:
rsrc_section = analysis.map[".rsrc"]
for o in analysis.carved[rsrc_section.start:rsrc_section.end]:
    print(f"* object {o.type} of {len(o)} bytes found at offset #{analysis.a2p(o.address):x}")
A few annotations will feature more complex access primitives. For instance the analysis.struct annotation, which lets you dive through structures and sub-structures identified by the file parser, needs to offer more accessors. But even for the more complex cases, we have tried to make everything pythonic and intuitive.
Editing
Editing also follows the same guideline. You want to add a comment? Use the comments annotation:
ep_rva = analysis.struct["OptionalHeader"]["AddressOfEntryPoint"]
ep_address = analysis.r2a(ep_rva)
analysis.comments[ep_address] = "This is the entry point!"
Add a symbol? we got you:
ep_rva = analysis.struct["OptionalHeader"]["AddressOfEntryPoint"]
ep_address = analysis.r2a(ep_rva)
analysis.syms[ep_address] = "TheEntryPoint"
Set the PE timestamp to the current date? Also easy:
import datetime
analysis.struct["PE"]["TimeDateStamp"] = datetime.datetime.now()    # cool right?
Force a function start? Not much more complicated:
analysis.fns.force(analysis.v2a(0x401000))
Etc. etc.
Going through code
Disassembling also follows the same syntax as seen previously. First you want to get a function:
ep_rva = analysis.struct["OptionalHeader"]["AddressOfEntryPoint"]
ep_address = analysis.r2a(ep_rva)
ep_function = analysis.fns[ep_address]
Then you want to iterate through its basic blocks via the analysis.cfg object. Note that Malcat has code and data basic blocks, so every byte of the file is inside a basic block:
for bb in analysis.cfg[ep_function.start:ep_function.end]:
    if bb.code:
        print(f"Found code basic block at {analysis.ppa(bb.start)}")
And finally, you can iterate through instructions using the analysis.asm annotation:
for bb in analysis.cfg[ep_function.start:ep_function.end]:
    if bb.code:
        for instr in analysis.asm[bb.start:bb.end]:
            print(f"{analysis.a2v(instr.start):x}: {instr}")
            for operand in instr:
                print(f"    {operand.type} -> {operand.value:x}")
But since analysing code is such a repetitive and common task, there are also a couple of shortcuts you can take. You can directly iterate through functions (yields basic blocks) and basic blocks (yield instructions). So the code above can be written as:
for bb in ep_function:
    if bb.code:
        for instr in bb:
            print(f"{analysis.a2v(instr.start):x}: {instr}")
This should be short enough even for the laziest among us. And if you want to navigate through the code more efficiently, the three types of code-related objects we have seen (functions, basic blocks and instructions) offer more access primitives:
- You can list incoming references using Function.inrefs, BasicBlock.inrefs or Instruction.inrefs
- You can list outgoing references using Function.outrefs, BasicBlock.outrefs or Instruction.outrefs
- You can get a textual disassembly listing using Function.disasm(), BasicBlock.disasm() or Instruction.disasm()
- You can get a textual C code representation of a function using Function.decompile()
- You can navigate through callers/callees via Function.callers and Function.callees
- You can navigate through CFG predecessors/successors via BasicBlock.incoming and BasicBlock.outgoing
That's all we will need for our Latrodectus deobfuscator!
Use case: desobfuscating Latrodectus
The Latrodectus malware, also known as BlackWidow, is a backdoor developed in C which has been first identified in October 2023. Latrodectus is thought to be developed by the threat actor Lunar Spider. It is sometimes seen as the successor of IcedId, developed by the very same threat actor. The backdoor features some light obfuscation, mainly string encryption and an hash-based dynamic API call resolving, in order to make detection and analysis a bit more difficult.
We won't analyse the malware capabilities, which have been already covered in detail. Instead, we will focus on the obfuscation in place inside the malware and see how to leverage Malcat scripting capabilities in order to quickly decrypt the strings and resolve the API calls. Since this malware is relatively simple, it should make a gentle introduction to Malcat's API.
Resolving API calls
What is dynamic API lookup?
Malware need to use Windows APIs like any other software in order to interact with the Windows operating system. But very rarely you will see malware import their APIs the normal way, i.e. by letting the linker list them inside the PE import table. Instead, what a lot of malicious programs do is to resolve the API addresses they use at run time. This helps them hide their true intent against static analysis tools (e,g, capa).
The APIs they need can be searched either by their name, or by a hash of their name. By using hashes, malware can avoid detection by static analysis tools that look for known API names. This technique complicates the reverse engineering process too, as analysts must first identify the hash and then determine which API it corresponds to.
API lookup in Latrodectus
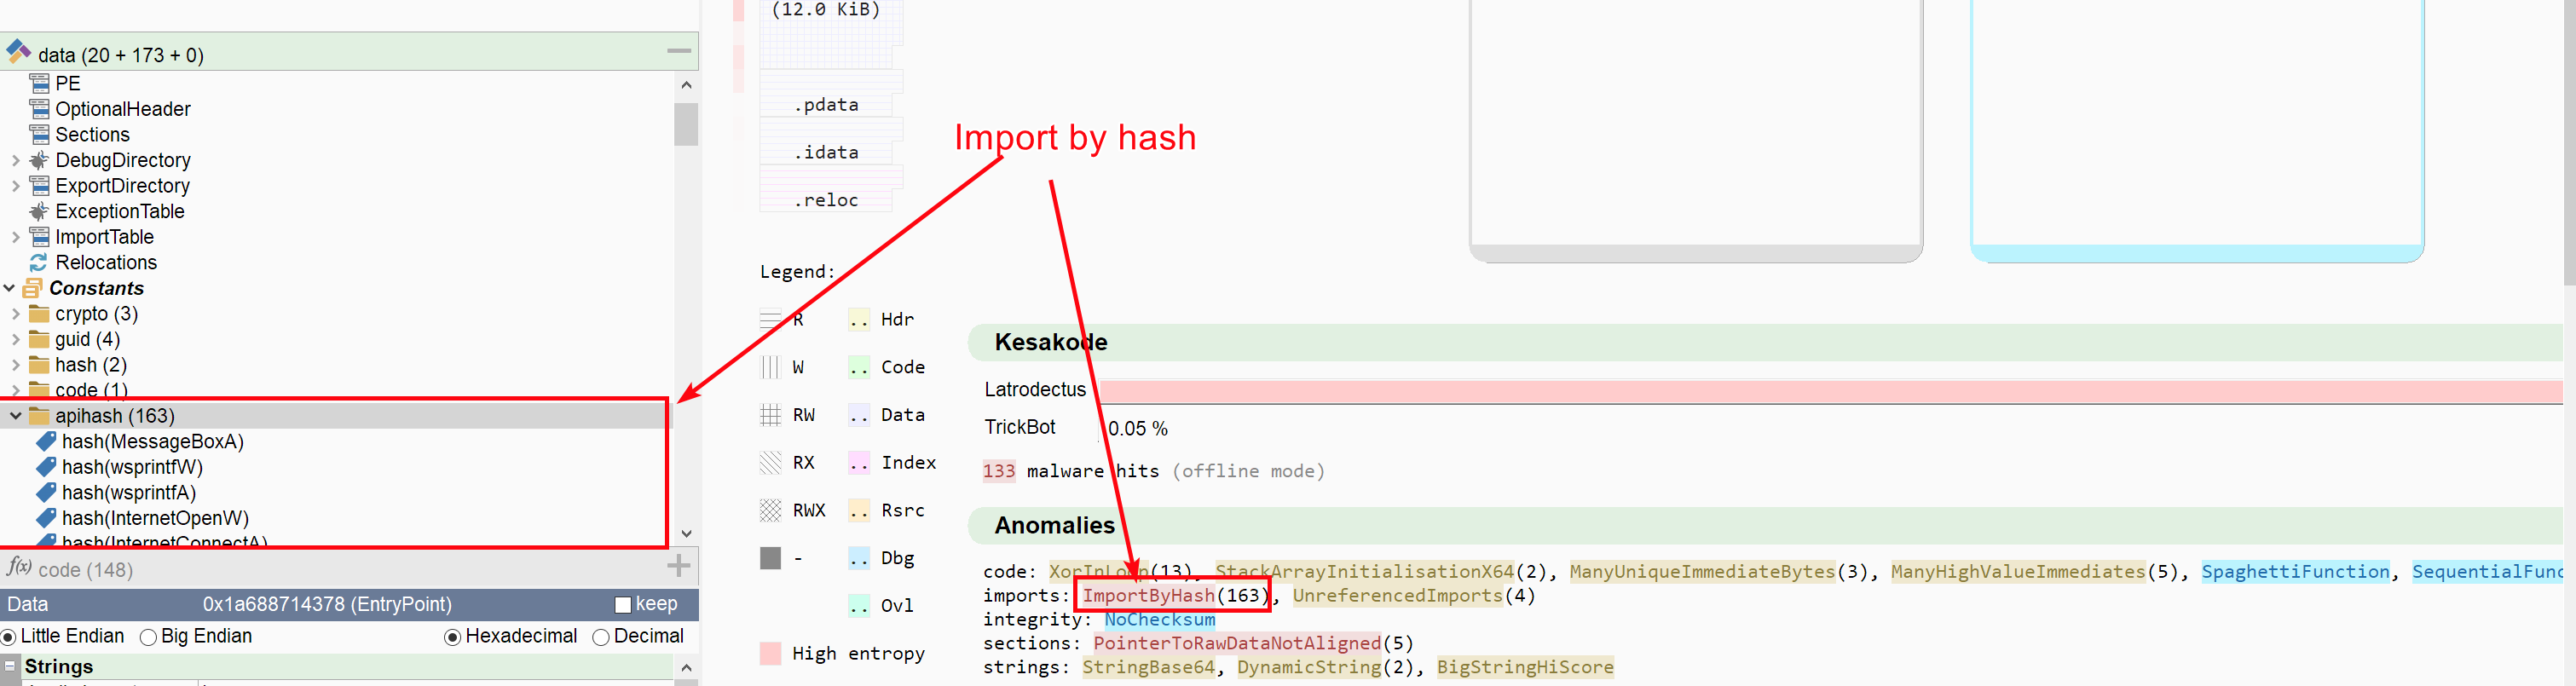
Latrodectus is no exception and performs dynamic API lookup by hash. Identifying this behavior is rather easy in Malcat: Latrodectus uses a well-known hashing function (CRC32) to hash the API name, and almost all the API hashes are identified by Malcat's constant scanner, as we can see below:
In the sample that we have analysed, API lookup is scattered across different functions. But the lookup process always follow the same pattern in each of these functions:
- An array is allocated on the stack
-
Each API that needs to be looked up is setup using a triplet on the stack:
- First element of the triplet is the (hardcoded) CRC32 hash of the API name
- Second element seems to be the previously computed CRC32 hash of the DLL
- The third element is the address where the resolved API pointer will be stored
You can see below an extract of one of the functions doing this kind of API lookup:
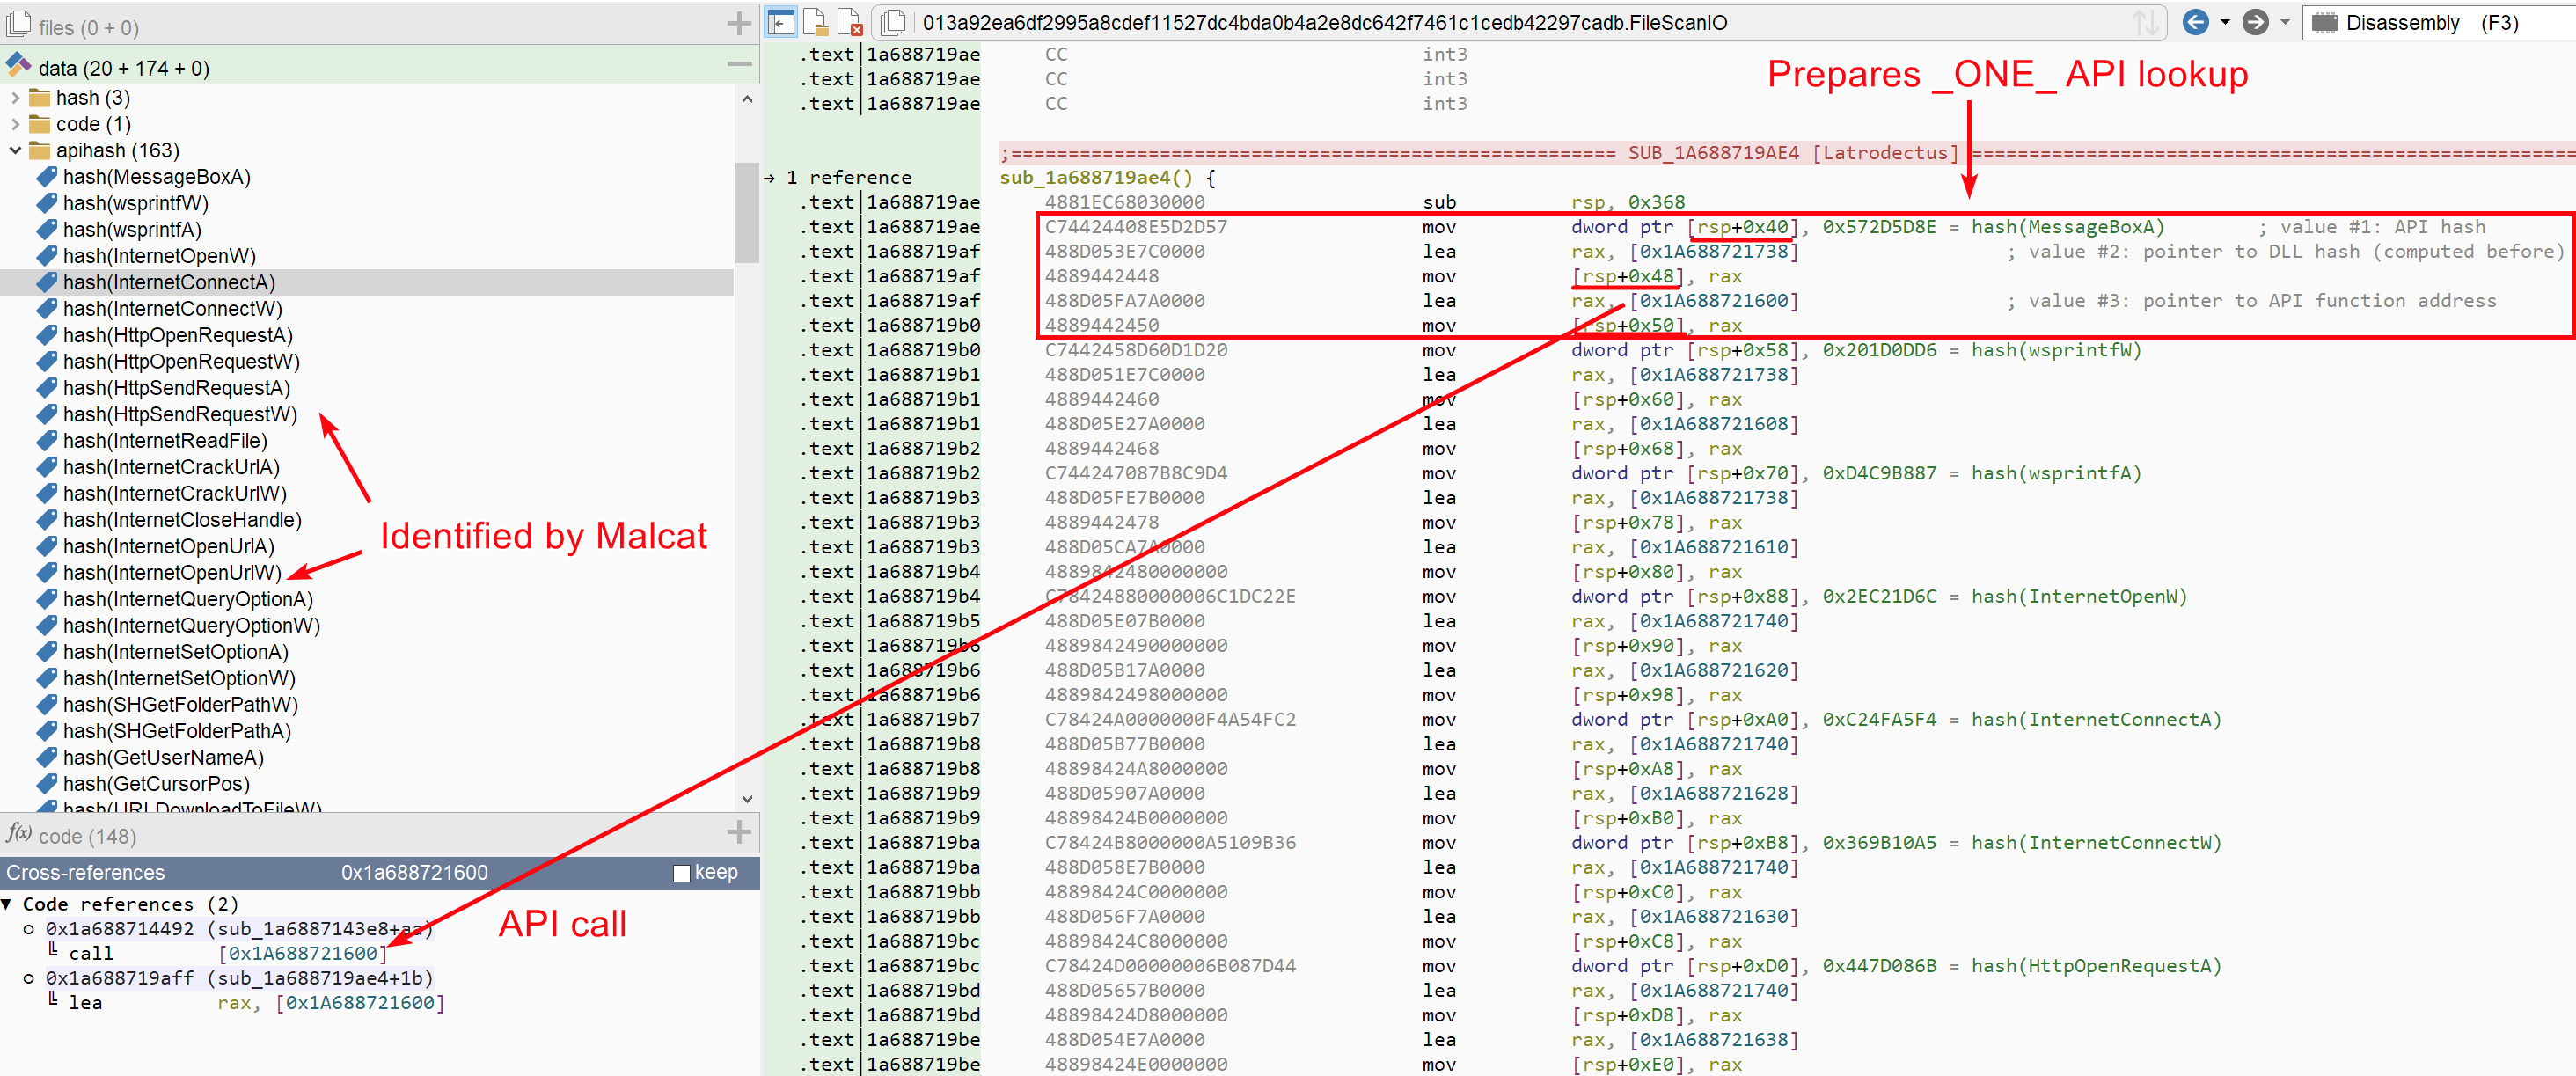
As we can see on the bottom left part if the screenshot above, API calls are hard to read for a reverser in this configuration. What would be nice, is having a symbol with the API's name on the third triplet's member, i.e. the API pointer actually used for calls.
The script
Now since Malcat was kind enough to identify the API hashes for you, you could add the symbols manually (Right click > Add/edit label). But we're talking about 163 hashes here, so it would be rather nice to automate this. Our plan will be as follow:
-
Identify all API hashes usage. For this we could:
- Go through all constants via the analysis.constants annotation
- Check each constant category and look for
"apihash" - Get the constant's use address
-
Starting from the constant's use location, go to the second lea opcode following the instruction:
- The API hash constant beeing located in the middle of an instruction, we need first to go the the start of the instruction using analysis.cfg.align()
- Next we need to iterate over instructions until we see two
leaopcodes - Next we need to get the second
lea's memory target: that's where the API address will be stored. We can iterate through instruction operands easily.
-
Finally, we need to add a symbol (the API name) to the second
leatarget, using the analysis.syms annotation.
So using everything we have learnt, putting a script together is relatively easy at the end:
1 2 3 4 5 6 7 8 9 10 11 12 13 14 15 16 17 18 19 | |
And if you want to see it in action:
That was pretty easy right? We can see that 4 API hash usages did not respect the "double-lea" pattern, but that's because they are used in a different context, which is beyond the scope of this tutorial. So let's count this as a 100% win!
Decrypting the strings
String encryption format in Latrodectus
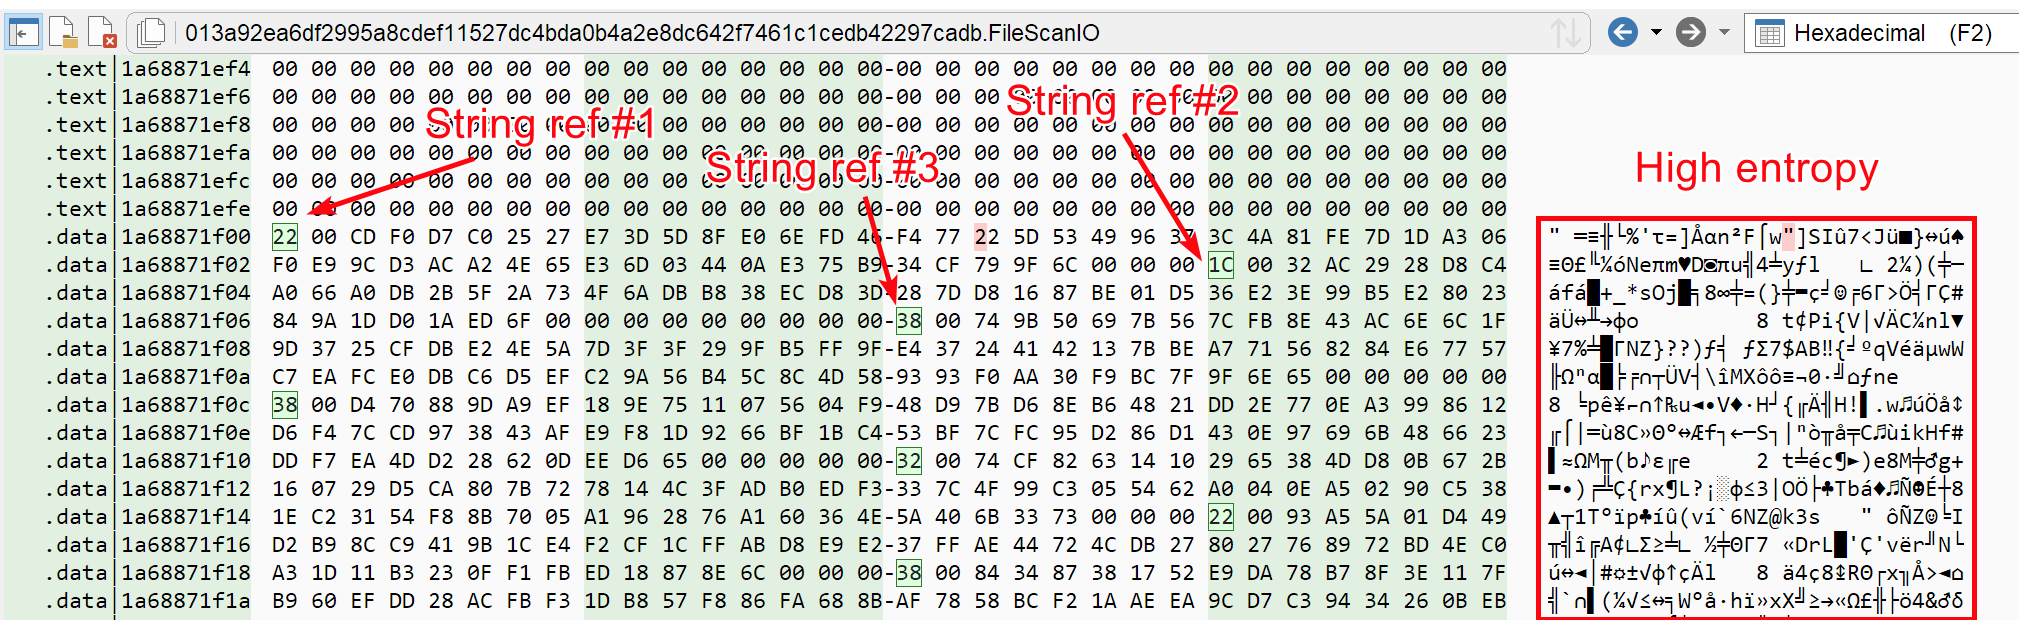
Now that API calls are visible to us, let us focus on the encrypted strings. If you look at the .data section, you will find high-entropy data. And even more interesting, this high-entropy data has incoming references scattered every 10-30 bytes (you can spot the incoming references via the small green highlighting):
All these incoming references stem from code, which looks always the same:
.9:
        lea          rdx, [rsp+0x220]
        lea          rcx, [0x1a68871f000]   ; <-- our high-entropy referenced data
        call         sub_1a68871bc60        ; <-- always the same function
And if it was not enough, the function called right after the reference (sub_1a68871bc60) displays some interesting properties:
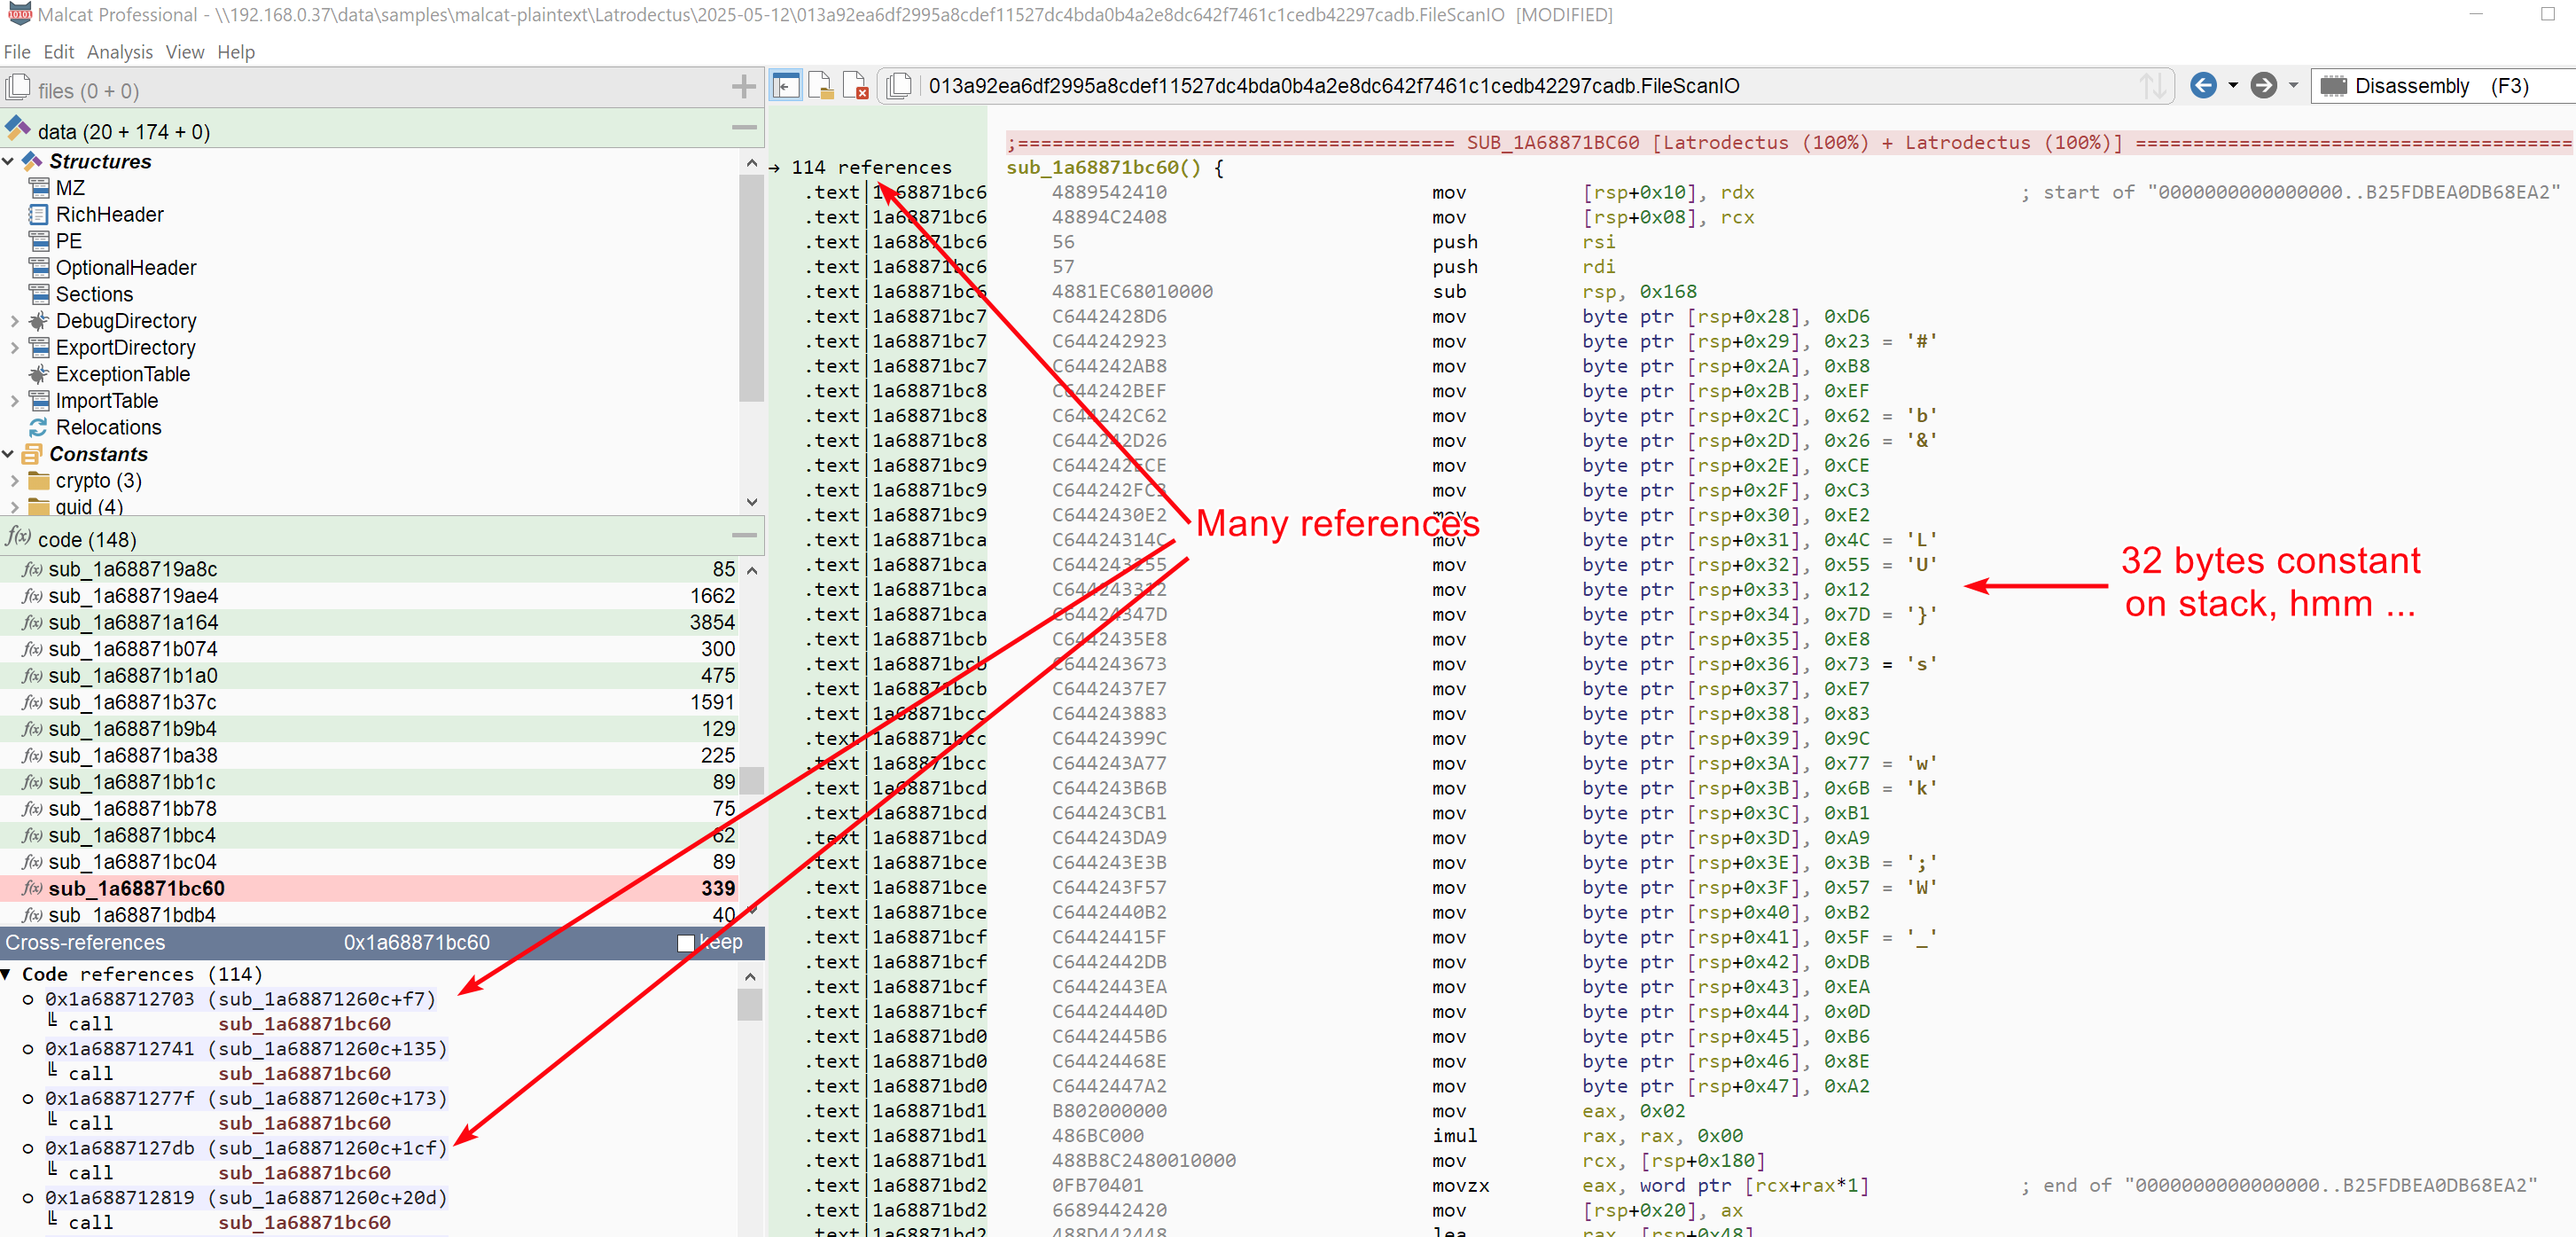
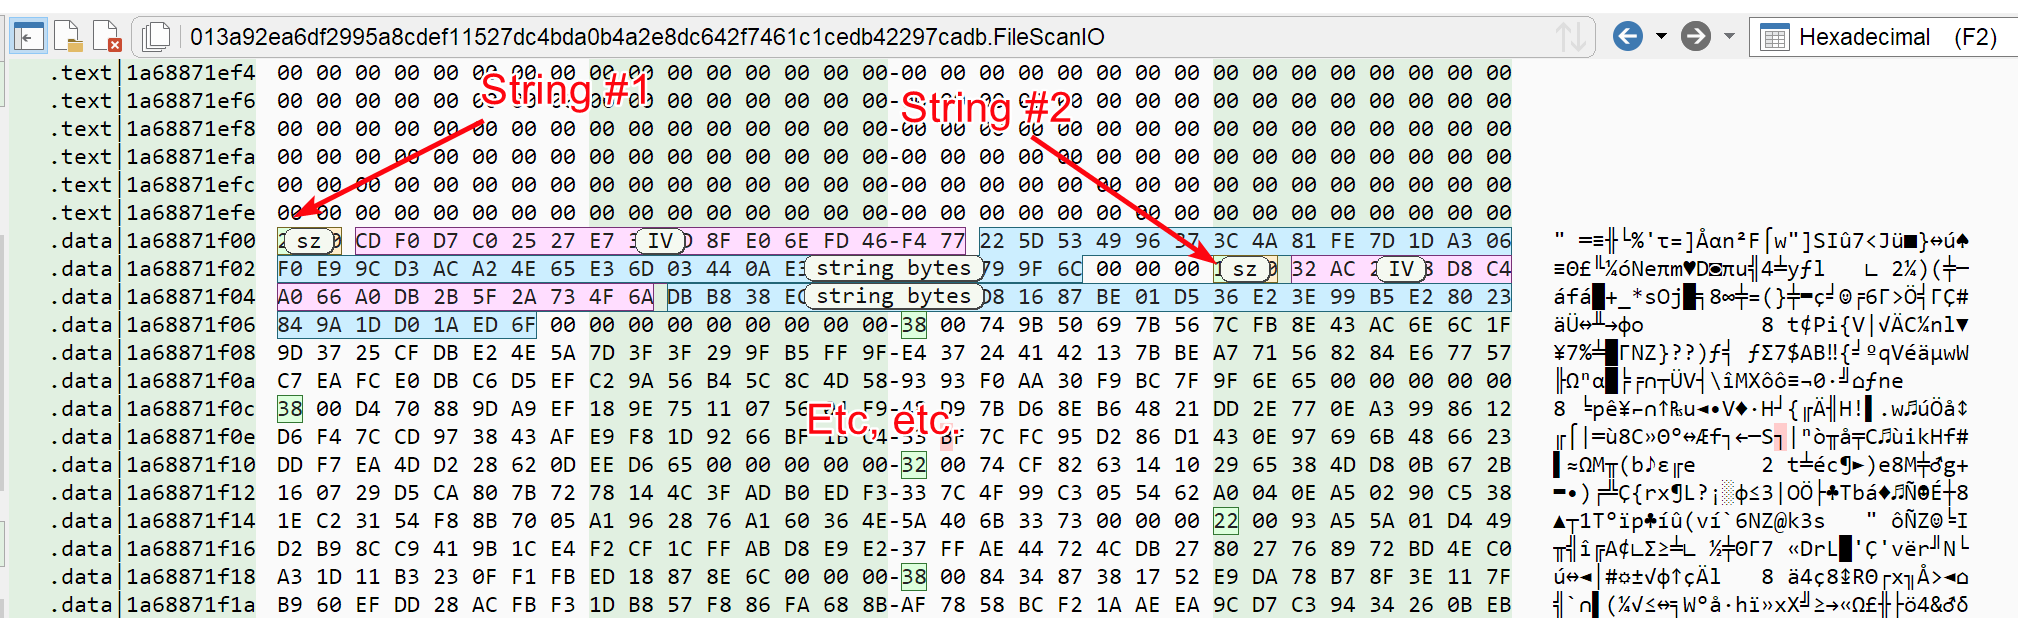
By now, your spider sense should definitely be tingling, or more appropriately hurling "string decryption routine" in your ear. But what kind of encryption? The 32 bytes constant points toward some block-cypher, especially since a couple of AES substitution blocks have been identified by Malcat. According to VMRay's blog, the latest version of Latrodectus uses AES-256 (CTR mode). The encrypted string format is as follow:
- A 2-bytes prefix tells us how big is the string
- The next 16 bytes are the initialisation vector (IV) used for encryption with AES CTR
- Finally, the encrypted string bytes
So at the end it looks like:
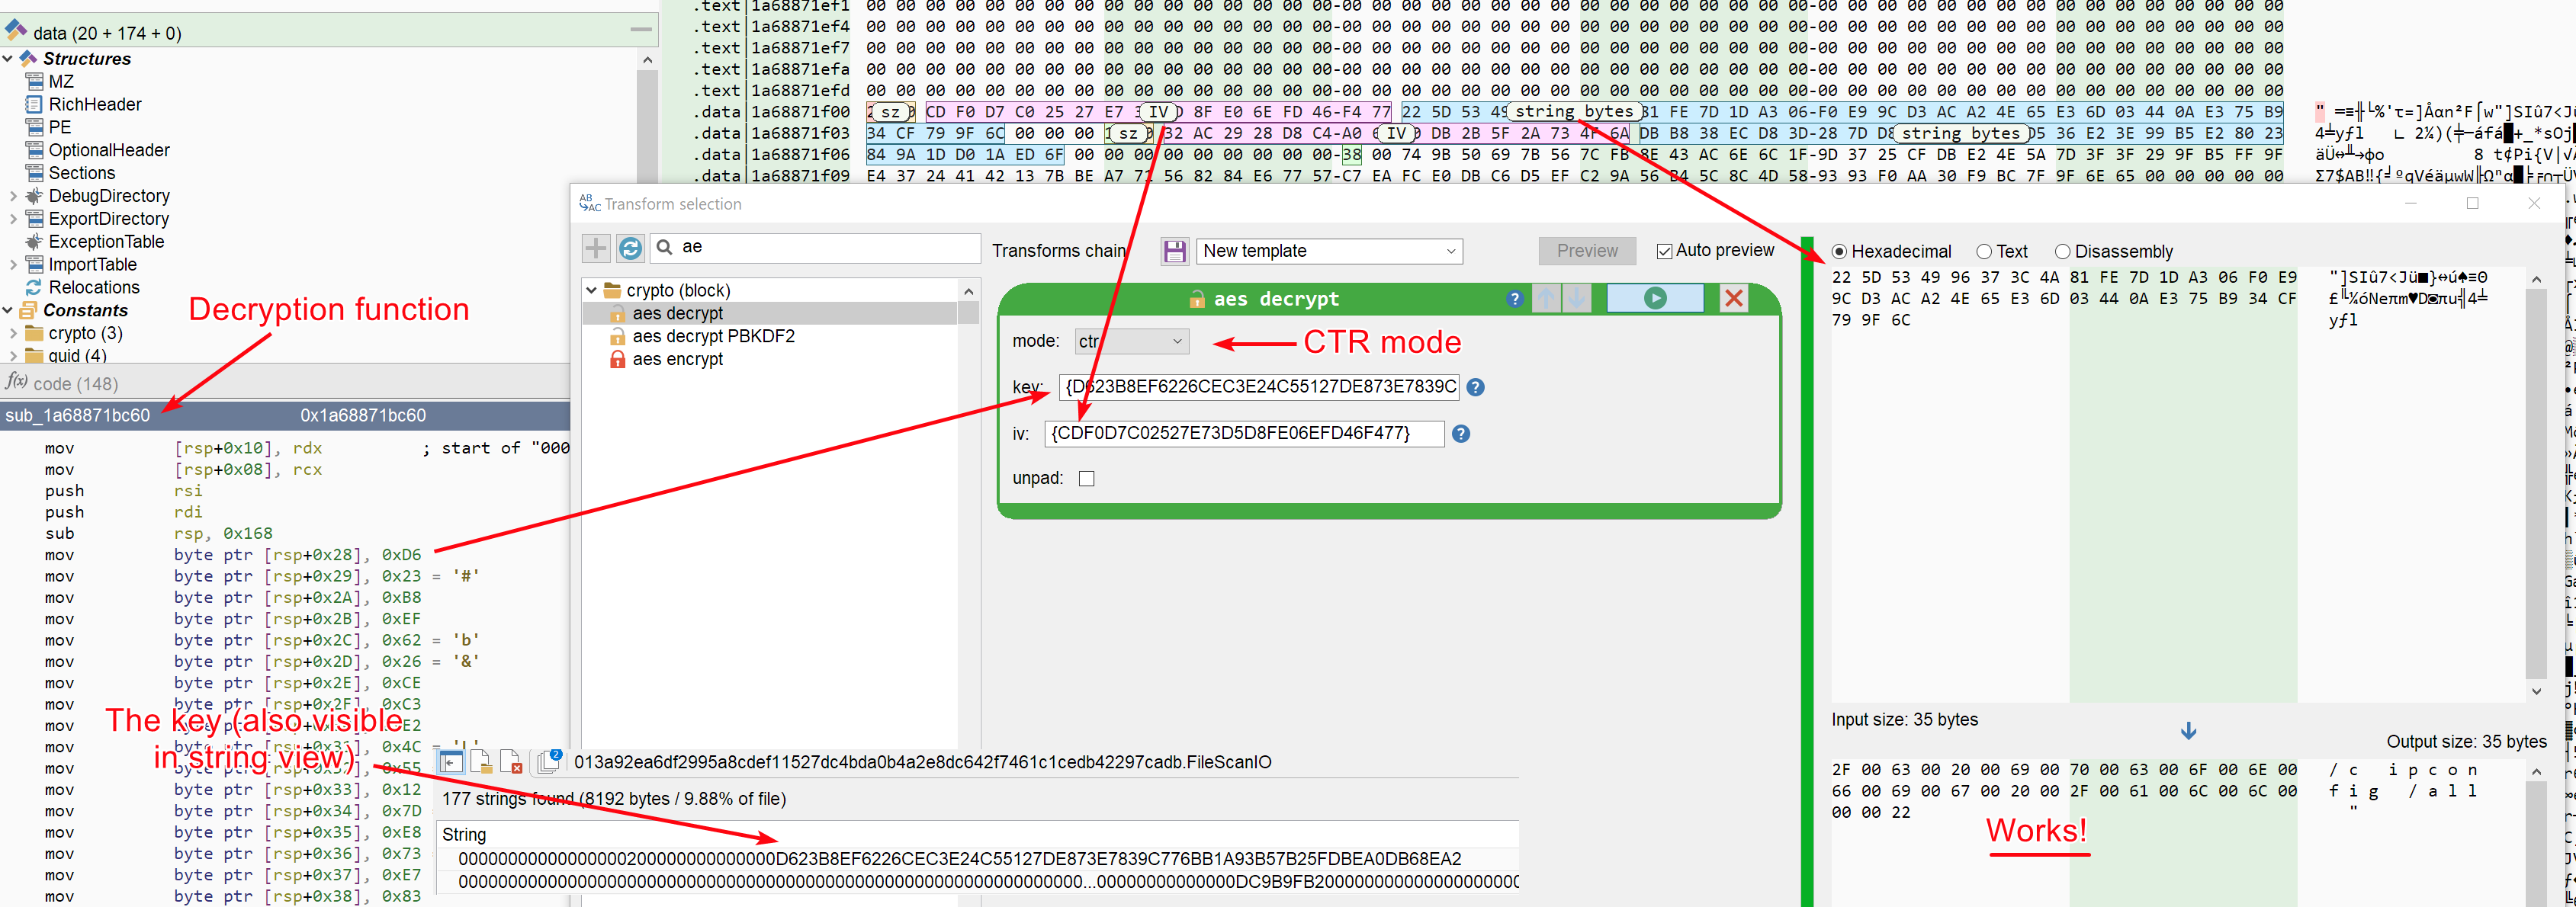
Let us put it to the test using Malcat's AES transform. The 32 bytes AES key can be obtained either from the decryption function's disassembly or from the string view (Malcat can extract stack strings, it's actually the one with the biggest score).
Since other values have been put on the stack in
sub_1a68871bc60, the recovered stack string is bigger than 32 bytes. You have to select the last 32 bytes:D623B8EF6226CEC3E24C55127DE873E7839C776BB1A93B57B25FDBEA0DB68EA2
And good news ... it works! Now we just have to figure out how to automate this for all encrypted strings in the .data section.
Locating the decryption function
The first item on our agenda is locating the decryption function, and if possible in a manner applicable to other Latrodectus sample. So instead of searching by address or by pattern, we will focus on what makes this function unique:
- It is called more than 100 times (i.e. it has more than 100 incoming references). It is unlikely that the number of string will decrease in the future.
- It constructs a dynamic string of at least 32 bytes on the stack
- ... and that's enough!
So let us convert that into code. We will use annotations and methods that we have already described: the analysis.fns annotation, the Function.inrefs attribute and the analysis.strings annotation:
1 2 3 4 5 6 7 8 9 10 11 12 13 14 15 16 17 18 19 | |
Listing encrypted strings
Second step in our journey: we have to locate all encrypted strings. This task is made considerable easier if we know the decryption function. The idea is to locate all these code patterns:
.9:                                         ; <-- this a the start of a basic block
        lea          rdx, [rsp+0x220]
        lea          rcx, [0x1a68871f000]   ; <-- the encrypted string
        call         sub_1a68871bc60        ; <-- the decryption function
To achieve this goal, we will follow all incoming references to the decryption function, then locate the start of the calling basic block: the first lea target of the basic block should be the address of an encrypted string. But enough words, let us implement this in python:
1 2 3 4 5 6 7 8 9 10 11 12 13 14 15 16 17 18 19 20 21 22 23 24 25 26 27 | |
Putting everything together
Now that we have the decryption function and all the encrypted strings, the only work left is actually decrypting the string. For this, we will call directly Malcat's AES transform. You can find its source code in data/transforms/block.py. Beside the usage of the transform, you won't find any notion in the script.
1 2 3 4 5 6 7 8 9 10 11 12 13 14 15 16 17 18 19 20 21 22 23 24 25 26 27 28 29 30 31 32 33 34 35 36 37 38 39 40 41 42 43 | |
If you want the complete script, you will be able to find inside your Malcat installation, in data/scripts/config/latrodectus.py. But let us see the script in action:
Conclusion
I hope that you've enjoyed this little introduction to Malcat API. If you want to go further (and you should!), just browse the online documentation for each available annotation:
- analysis.struct:
- navigate through all the structures and fields identified by the file parser
- analysis.entropy:
- access the file's pre-computed entropy
- analysis.strings:
- strings identified by Malcat's different string extraction algorithms
- analysis.asm:
- disassembled instructions
- analysis.cfg:
- basic blocks identified through Malcat's CFG recovery algorithm
- analysis.fns:
- functions identified through Malcat's CFG recovery algorithm
- analysis.loops:
- Strongly Connected Components analysis
- analysis.syms:
- Symbols (imports, exports, debug symbols, user symbols, etc.)
- analysis.xrefs:
- Cross reference analysis, i.e. lists everything that points toward a given address
- analysis.carved:
- All embedded files recovered by Malcat's carving algorithm
- analysis.vfiles:
- Virtual files, i.e. all files listed by the current file parser. For instance, the members of a ZIP archive.
- analysis.constants:
- All known constants identified by Malcat's constant scanner
- analysis.sigs:
- All matching matching and non-matching Yara signatures
- analysis.anomalies:
- All anomalies identified by Malcat and their location
- analysis.highlights:
- All user highlighted regions
- analysis.kesakode:
- All kesakode hits and their location
And don't hesitate to share your scripts. Remember, free users can use them too!